
This post is for everyone that expects hype and [Gamestop] takeoff daily. Please calm down, we still have time. The countdown is ticking though and I want to show you where you can look it up – again, everything I’m writing about here has been said by /u/WardenElite, so credits go to him.
I’ll write this explanation in a way that even my baby bottom smooth brain could understand it, so I’ll try to explain abbreviations and such as good as I can. As a result, I’ll oversimplify a lot. That’s also why I’ll likely make some mistakes – I apologize in advance, please correct me in the comments.
Original post “Why sideways days are the best that could happen – the bomb is ticking!” by AvocadoDiavolo. This copy is for archive purposes and is not a financial advice.
What exactly are we looking forward to?
The explosive rise of the stock price in the case we are looking forward to is called a gamma squeeze. You can understand gamma like acceleration if delta is the speed of the price change. Imagine like it’s how far the throttle of our rocket is pushed forward.
A gamma squeeze then has to do with Market Makers (MM) “hedging” options.
Options are contracts that give you the option (hence the name) but not the obligation to buy 100 pieces of an underlying asset – like GME stocks – at a predetermined price (stike price). Those contracts also always expire at a predetermined date.
Generally speaking, you profit from the difference between the strike price and the current market price when you execute the option. If that is the case, the option is “in the money” (ITM). Otherwise it’s called “out of the money” (OTM) or occasionally “at the money” (ATM) when both prices are the same. In this case, we’re interested in “call” options – those that bet on the stock to go up. The price of these options is mainly determined by two things: Likelyness of it ending up ITM and a thing called “implied volatility” (IV). The latter is a unit for measuring how wildly the stock price moves – it’s how the MM determines his/her risk of having to hand over the shares at the stike price as opposed to the current market price.
The MM has the risk of losing money in this process, so he/she does a thing called “delta hedging”. Depending on the risk of the option really ending up ITM, he/she buys a certain ammount of assets, just in case the options owner decides to execute the option in order to remain “delta neutral” – meaning that the MM doesn’t have to worry about whether the option ends up ITM or OTM. He/she has to constantly check that position and adjust as the market changes.
So if the stock goes up and triggers some calls, the MM doesn’t have to buy those stocks at that point in time because it has already been hedged before. If not, that would cause a chain reaction because a sudden buying of shares for ITM calls would of course let the stock price rise further, triggering even more calls to end up being ITM. This is called a gamma squeeze because the gamma (acceleration) gains such a momentum through the chain reaction that the price can end up at ridiculous heights. But because of delta hedging, that can’t happen.
Triggering a Gamma Squeeze
So under what circumstances can a gamma squeeze happen? Obviously calls have to be cheap so there are a lot of them and also the Market Makers must not me able to hedge them in time. This means, we need two things for the squeeze:
- A lot of available near ITM calls that have 0DTE (zero days to expiry) – 1DTE could work as well but is less likely to trigger a squeeze.
- low IV so the price of the calls is low.
With a low enough IV, tons of near ITM calls can be bought. Delta hedging needs to happen in with enough time to react. If there are only a few hours left to hedge everything, the stock price rockets up, more calls end up ITM and the rocket goes higher and higher. Also, those hedged shares have to be bought at current market price. If there are no shares available, the price rises until someone decides to sell. Hence: Diamond hands!
Reading the countdown
So for the likeliness of a gamma squeeze to happen, we need to find resources that tell us about the above mentioned things.
The current state of availabe options can be looked up in depth on OptionSonar, or if a quick look suffices, there’s also iBorrowdesk. I use the latter because I lack wrinkles and I’m scared of all that data.
Warden uses Think Or Swim (TOS) by TD Ameritrade, so I’ll refer to that. This is one hell of a powerful tool and I get anxiety attacks even thinking about it but it’s the only place I know where to find IV data. Better even, it also has a graph showing the historical volatility – so like a superimposed median volatility number of what the volatility in the past usually was. This makes it really interesting.
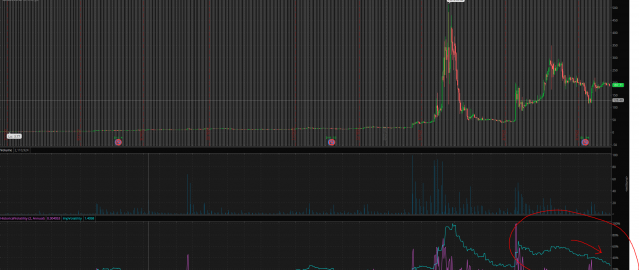
If I may blatantly steal an image posted by Warden today, you can see the history of IV and HV together with the price action here:
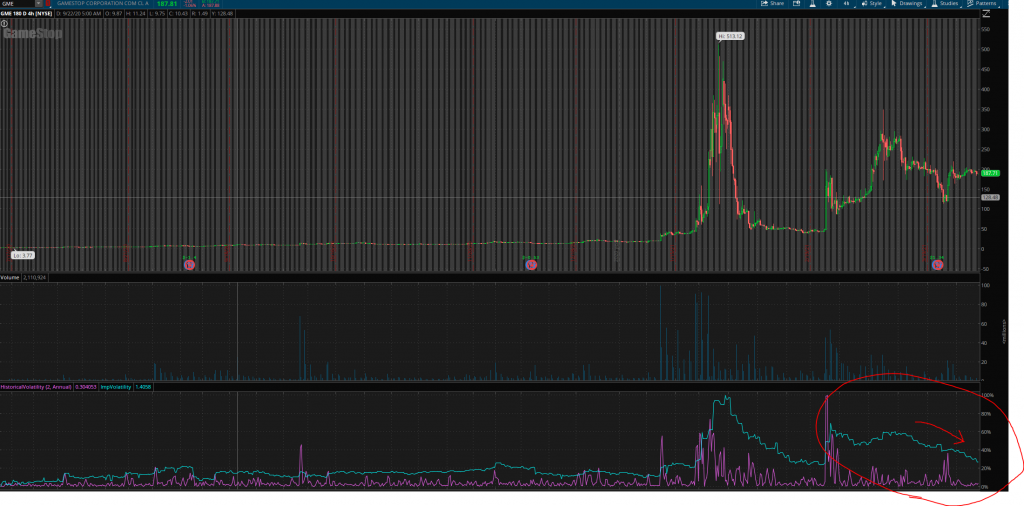
In the upper half if the image you can see the GME stock price within the last year and in the bottom half you see the volatility. The cyan line is the IV and the purple line is the HV. You see that HV has been pushed up by the crazy IV during the squeeze and now slowly settles down again.
Notice how the Jan/Feb squeeze happened when the IV peaked above the HV? That’s when both above mentioned conditions were met. Also notice when the last two price takeoffs happened when the IV shortly peaked but no real squeeze happened? That’s because HV was still too high. But because of the “boring” sideways action during the past weeks, HV gets lower and lower…
Why there are still short attacks
So now we learned about the close relationship between volatility and gamma squeezes. With this, we can clearly understand why Citadel and consorts still try rocking the boat: They try to get volatility up by creating crazy price movements. But as apes buy and hold more and more stocks, there is less and less to work with for them to create those movements – hence the HV can settle down.
When Lambo
I will not commit to a date! Dates are no good! Rather refer to conditions met. One suspicion could be – judging from the above chart – that HV could continue to move like it did during the last three weeks. In that case, a proper short squeeze could be triggered towards end of April, maybe even sooner.
When triggered, the actual flight of the rocket will take a while. It could become bumpy if there are enough paper hands but I hope that by now diamond hands have become enough of a popular meme to prevent that. Without, our adversaries won’t have anything to stop or even slow it down. That means: HODL even if the takeoff rips your jimmies off! If at all, only sell after the peak. Imagine paper handing at $1,000 only to watch the rest of us blasting past the moon and selling after the peak at $20,000,000. Expect ridicule.
So that’s all I have. Thanks for staying with me. There is no TL/DR because I can’t be bothered if you can’t be bothered. Please drop a like, subscribe and comment here, also buy me a beer and SHOW ME THE MONEY!
